Profiles & targets

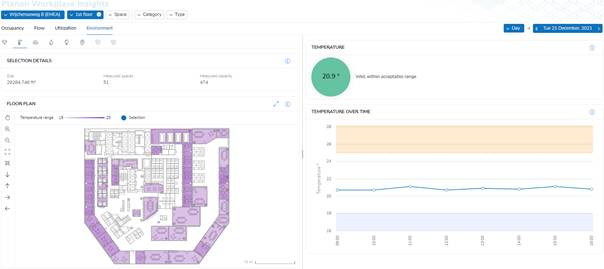
Environmental Dashboards can show Environmental Targets (Boundaries), for example below:
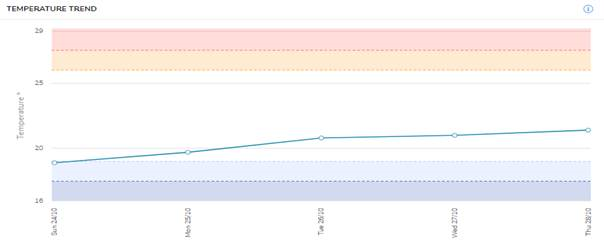
The colors define the low and high targets on Environmental values. These targets can be set on Profiles & targets TSI.
An Environmental Profile is predefined in the accelerator. Profile with a set of Environmental Targets. This Profile is set to Default. There can only be one Default. On the Profile you can set:
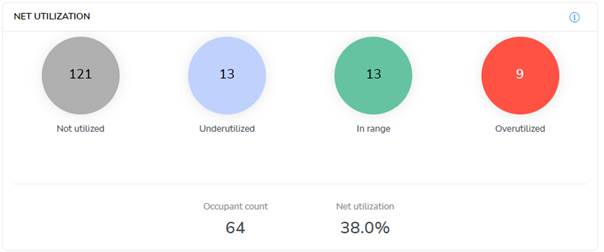
Undercapacity
(used in Utilization Dashboards).
Define with Customer what their Undercapacity boundary is. For example: Undercapacity is set to 50.
When a space has a max capacity of 10 people and there are < 5 people counted in the space (by sensor) the space is “Underutilized”.
When there are 5 to 10 people counted it is “In range”. When the count exceeds 10 people, it is “Overutilized”.
The Comfort Score Boundary
(used in Environmental Dashboards).
Define the customer's Comfort score boundary. For example: the total score of the comfort score is acceptable when 85. When the comfort score is < 85, the Bulb will be red.

When the comfort score is => 85 the Bulb will be green.

Target values
Per Profile a set of Environmental Targets can be set. There is already a predefined set available for the most important (shown in Dashboards) Environmental Targets.
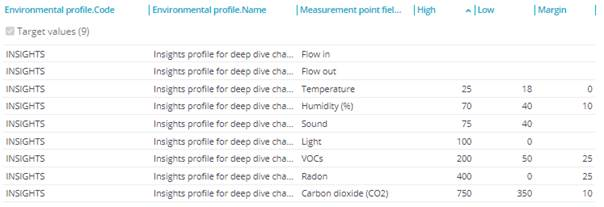
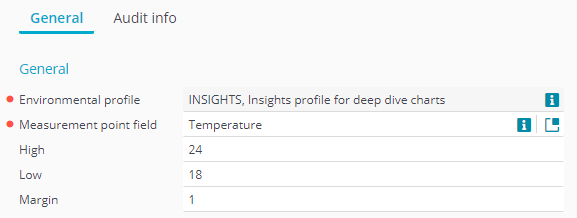
These targets also define the range coloring on the floorplan, Bulb view with the values within range or not and Environmental values over time. Below example is on Temperature Value:
